

Inflation affects everything from grocery bills to rent, making the Consumer Price Index one of the most closely watched economic indicators. What does inflation mean at the micro level — specifically to your household?
The Bureau of Labor Statistics (BLS) divides all expenditures into eight categories and assigns a relative size to each. The pie chart below illustrates the components of the Consumer Price Index for Urban Consumers, the CPI-U, which we’ll refer to hereafter as the CPI. The BLS weighs these annually with the latest weighting taking place in December 2025.
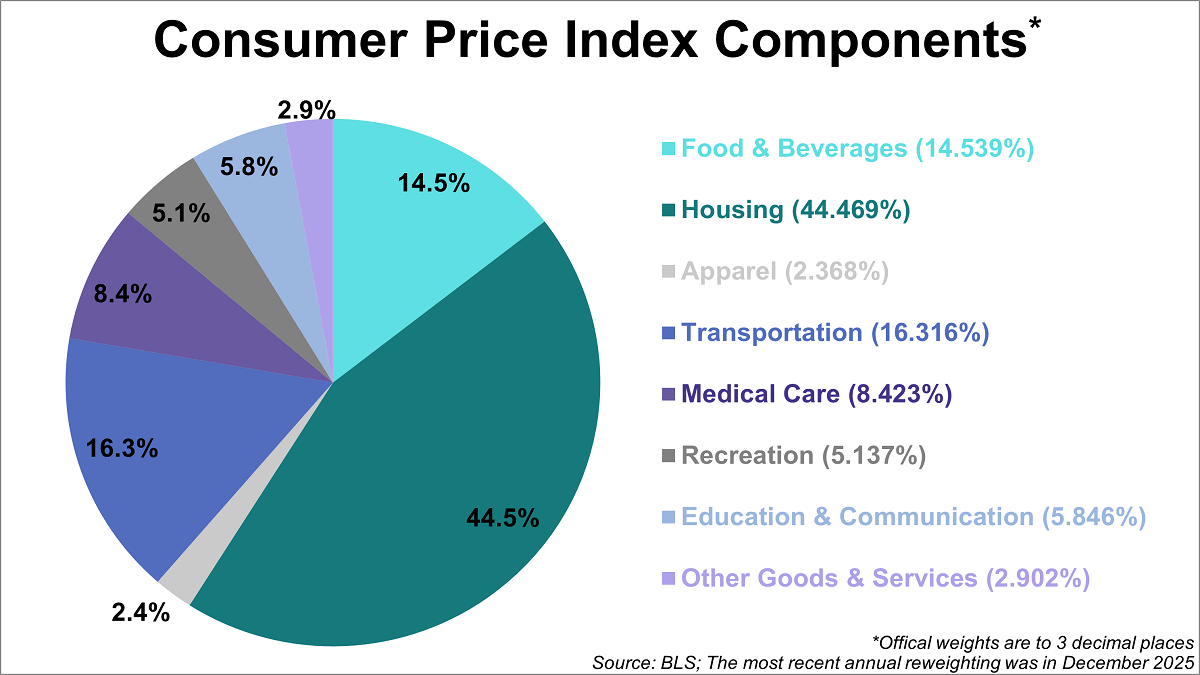
The categories in the pie chart are listed in the same order as the BLS tables, not by their relative size in the index. The first three follow the traditional order of urgency: food, shelter, and clothing, which account for over 60% of the index. Transportation comes before Medical Care, and Recreation precedes the lumped category of Education and Communication. Other Goods and Services refers to a bizarre grab-bag of odd fellows, including tobacco, cosmetics, financial services, and funeral expenses. For a complete breakdown and relative weights of all the subcategories of the eight categories, here is a useful link.
CPI Component Growth
The chart below shows the cumulative percent change in price for each of the eight categories since 2000.
 Not surprisingly, Medical Care and Housing have been the fastest-growing categories, each growing more than 100% since the turn of the century. The Food and Beverage category is the other one up over 100% in large part due to the steep spike in prices following the pandemic.
At the opposite end is Apparel, which is up only 3% since 2000 but has even deflated at times. Another unique feature of Apparel is the obvious seasonal volatility of the contour line.
Transportation is the other category with high volatility — much more dramatic and irregular than the seasonality of Apparel. Transportation includes a wide range of subcategories, such as motor vehicles, fuel, parts/equipment, maintenance/repair, insurance, fees, airline fares, etc. The volatility is largely driven by the Motor Fuel subcategory, which has surged recently as ongoing geopolitical conflicts continue to cause fluctuations in global energy prices. For a closer look at gasoline, see this chart in our weekly gasoline update.
CPI: The Ominous Shadow Category of Energy
Unlike other spending categories, the BLS does not treat Energy as a standalone expenditure category. Instead, energy costs are distributed across Housing and Transportation expenses. Also, energy costs are indirectly reflected in expenditure changes for goods and services across the Consumer Price Index.
The BLS does track Energy as a separate aggregate index, comprised of household energy under the “fuels and utilities” index (Housing category) and the motor fuels index (Transportation category). As of the latest weighing (December 2025), Energy has been assigned a relative importance of 6.297 out of 100. In other words, Uncle Sam calculates inflation on the assumption that energy in one form or another constitutes 6.3% of total expenditures, 2.9% goes to transportation fuels — mostly gasoline, and 3.4% goes to household energy — mostly electricity.
The next chart overlays the highly volatile Energy aggregate on top of the eight expenditure categories. We can immediately see the impact of energy costs on transportation.
College Tuition – The Inflation Nightmare
The next chart will come as no surprise to families footing the bill for college tuition. The BLS weights College Tuition and Fees at 1.351% of the total expenditures. But for households with college-bound students, the relentless growth of tuition and fees can cripple budgets.
Here we’ve separately plotted the College Tuition and Fees subcategory of the Education and Communication expenditure category, which is up nearly 200% since the turn of the century. Note that the steady staircase in this cost matches the annual cost increases in late summer for each academic year.

However, the chart above may exaggerate the impact of tuition inflation. The BLS calculates tuition based on sticker prices, which often don’t reflect the actual costs paid after financial aid and grants. A 2014 New York Times piece, How the Government Exaggerates the Cost of College, explains that the government data ignores financial-aid grants which substantially lowers the real cost to consumers.
Daycare & Preschool – The Early Years Inflation Trap
The financial burden of early childhood care has become an increasingly daunting hurdle for families. The BLS weights Daycare and Preschool at just 0.699% of total expenditures, meaning its impact if often diluted in headline inflation reports. However, for households with young children, these costs represent a primary and non-negotiable expense that can rival or even exceed monthly housing payments.
For the first two decades of the century, daycare costs tracked closely with the high inflation seen in Medical Care, though consistently above. This changed near the end of 2022 when daycare costs began to surge at an accelerated rate compared to their previous trajectory, likely due to the expiration of pandemic-era stabilization grants and a tightening labor market. Now up over 160% since 2000, this category has transformed from a steady climb into a steep ascent, placing an unprecedented strain on the modern family budget.

Core Inflation
Economists and policymakers (e.g., the Federal Reserve) pay close attention to Core Inflation, which is the overall inflation rate excluding Food and Energy. Now this is a somewhat peculiar metric in that one of the exclusions, Energy, is an aggregate that combines specific pieces of two consumption categories: 1) Transportation fuels and 2) Housing fuels, gas, and electricity. The other, Food, is a major part of the Food and Beverage category. Interestingly, while the BLS excludes food and energy from Core Inflation, alcoholic beverages remain in the calculation.
The next chart shows us the annualized rate of change (solid lines) and the cumulative change (dotted lines) in CPI and Core CPI since 2000. As of July 2026, the annualized rate of change for headline CPI is 3.36% while the annualized change for core CPI is 2.48%. However, the cumulative change in these series since 2000 is 98.4% for headline CPI and 89.2% for core CPI.

Consumers, especially those who’ve managed expenses over several years, are most closely attuned to the top line because the cumulative perspective makes it easier to grasp the real impact of inflation on purchasing power over time.
Inflation and Your Household
The universal response is to moan over price increases and take delight when prices are cheaper. But in reality, households vary dramatically in the impact that inflation has upon them.

For example, when gasoline prices skyrocket, a two-earner suburban family with long car commutes suffers far more than the metro family with short subway commutes or remote workers with no commute. And the pain is even more extreme for low-income households whose grocery money shrinks when gas prices rise. And remember, Uncle Sam excludes energy costs from core inflation. Additionally, households with high medical costs are significantly more vulnerable than comparable households with low expenses in this category.
One thing is certain: Inflation volatility hits hardest for lower-income households, those on fixed incomes, and families with high costs in tuition, daycare, transportation, or medical care. And for those with little room in their budgets, discretionary spending often remains just a dream.
Originally published on Advisor Perspectives.
For more news, information, and analysis, visit the Commodities Channel.

